We talk quite a bit around here about philosophy, literature, long walks; the idea is to discuss different ways of seeing the world, points of view that expand our horizons and allow us to incrementally break out of the Jail that our minds fit themselves into over time. Once in a while, we also talk about personal finance—for one of the things that keeps many people too distracted to stop and see things differently is a constant pursuit of money and consumption of stuff that it can buy. The earlier manifesto laid out one alternative approach to money, whose punch line is this: money shouldn’t be used to buy stuff, it should be used to buy freedom. In fact, my wife and I originally created the term Jailbreak to refer to finances: breaking out of the rat race that held our time and best mental cycles behind bars. It evolved into what it is today as we reflected on how the relationship with money is only one part of an issue that pervades our larger lives.
So I, being an engineer, love to play with the numbers that relate to financial Jailbreak: how much money do we need to save to retire early, how much passive income do we need to live, and just where would it go? I’m not alone; many of my fellows on the internet discuss these things on forums and blogs of their own, analyzing early retirement scenarios until they are blue in the fingers. Today’s post fills a gap that I haven’t seen addressed anywhere else: the relationship of the Safe Withdrawal Rate (SWR) to the Price/Earnings (PE) ratio of the stock market.
The slow dance of SWR and PE
What is the SWR?
A quick background, for those not intimately familiar with the subject: start with the assumption that you have a truckload of money saved for retirement, and you want to know how much of that money you can spend every year and not run out before your retirement ends. Assume, also, that your money is invested in stocks and bonds that earn passive income, but whose prices fluctuate with the market. The answer to how much you can spend each year is impossible to know ahead of time, because nobody knows how the stock market will perform during your retirement. On the other hand, it’s simple to calculate for hypothetical retirements that occurred in the past. So if, for example, you pretend to have retired in 1955, all of the data exists to calculate the percentage of your money you can withdraw every year, adjusted for inflation: your SWR.
The calculation of the SWR was done first by William Bengen, and then by the Trinity Study; Wade Pfau has updated and summarized the arguments. The findings are summarized in Figure 1.
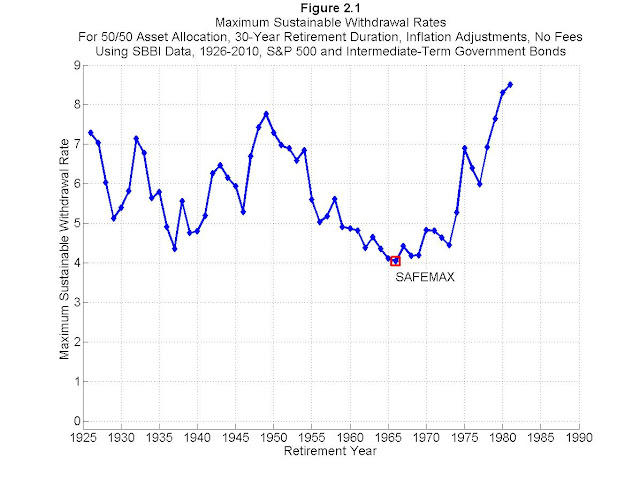
The history of a whole movement can be summed up as follows: in all of recorded US market history, the Safe Withdrawal Rate has never been below 4%. So if you have a cool $1M invested, you can spend $40,000 annually, adjusted for inflation, over the course of your 30-year retirement, and never in history would your strategy have failed. The 4% SWR has become the dominant rule of thumb throughout the personal finance and retirement planning spheres. No matter where you turn, you will find a discussion. See Mr. Money Mustache, Go Curry Cracker, jlcollinsnh, and more.
What is the PE ratio?
Buying a share of stock (Apple, IBM, Johnson & Johnson…) is buying a small piece of a company, and, in theory, the rights to a share of the profits (the earnings) of that company. There’s a large academic literature out there about how to value shares of company stock…what is a reasonable price? One measure that usually comes up is the PE ratio, which is, as its name implies, the ratio of the stock’s price to the company’s earnings per share. A stock with a PE ratio of 10, for example, is priced at 10 times the company’s earnings per share. Another way of looking at that is to invert the ratio: the earnings are 1/10 = 10% of the stock’s price, and you can think of that as, roughly, the return on your investment. You won’t actually get paid 10% for owning the stock, though; the company may pay dividends (say, 2%), the stock’s price may grow a bit, and the may invest the rest of the earnings in growing the business or developing new products. Since you own (a part of) the company, the benefits of all those activities accrue to you, in cash payments or in the prospect of future growth.
So what are people willing to pay for when buying stocks? They’re willing to pay, as it turns out, anything from 5 to 100 times the earnings per share; seen another way, they’re willing to accept returns of somewhere between 20% down to 1%, depending on their mood. But generally, the number is somewhere between 10 and 25, with a mean of about 15. (Technical note: I’m going to use the Shiller PE ratio, which replaces the current-year earnings with the average of the past 10 years of earnings, to produce a smoother result. Some people argue that the Shiller ratio more accurately reflects valuations.) Historical values of the PE ratio are shown in Figure 2.
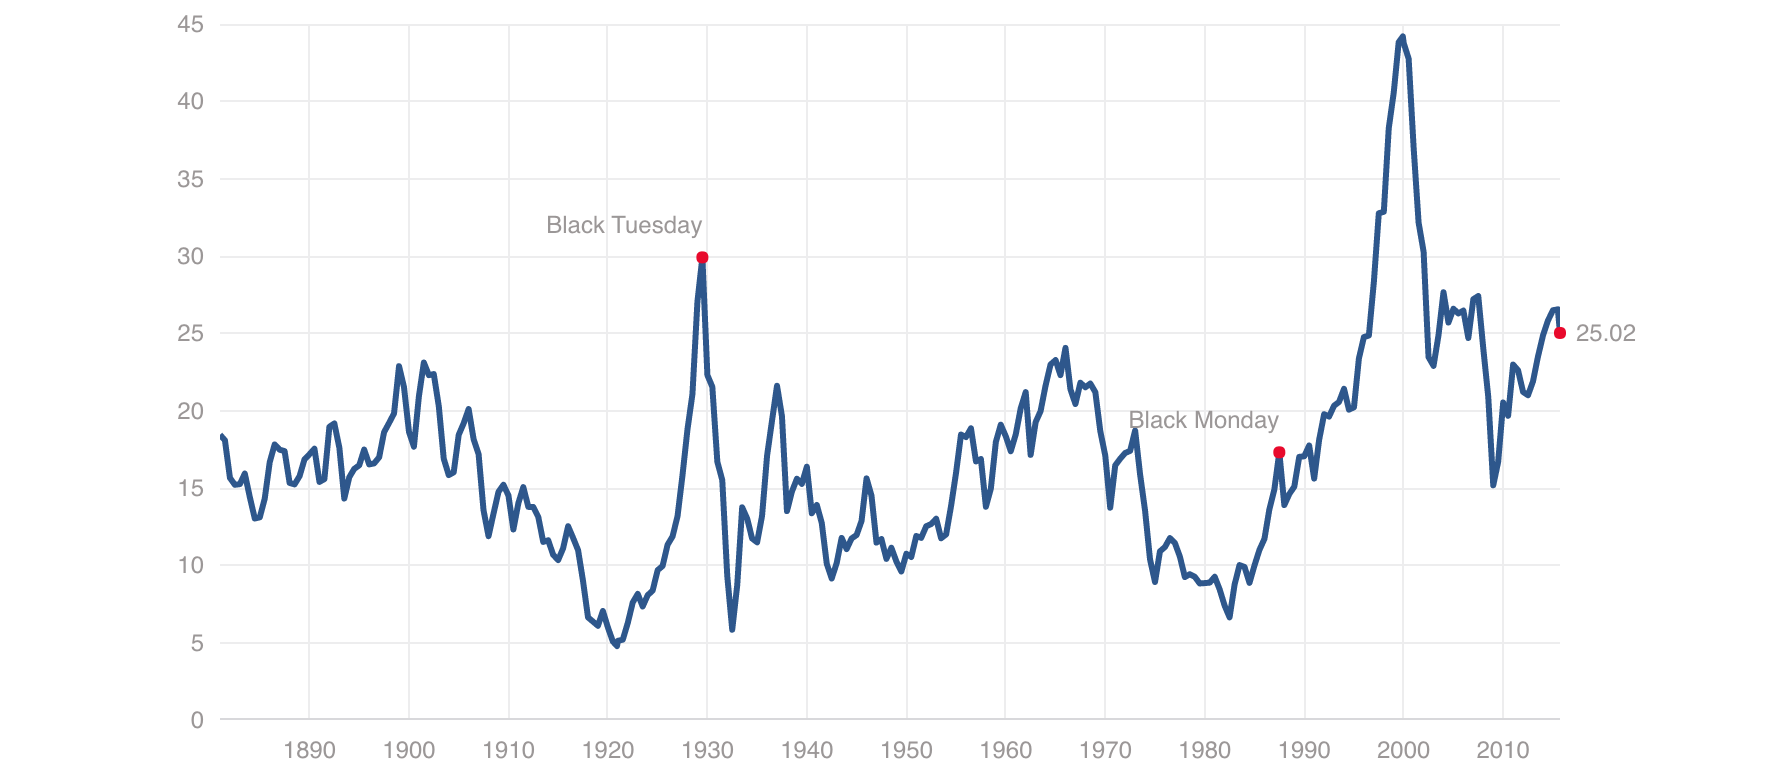
What goes up, must come down. When the PE ratio gets too high, what generally follows is a stock market crash. The crashes of ’29, ’01, and ’08 are all apparent. Currently, the PE ratio is 25; that implies that investors, generally speaking, are willing to accept a 4% return on their money. And since the historical average is around 15, there is some likelihood that the price of stocks will fall from their current ‘lofty’ levels to more normal valuations—and that the owners of stocks will lose money in the process.
How the PE ratio affects the SWR
It’s pretty well known that returns from stocks trend lower at higher PE ratios. So, naturally, retirement planners (and early retirees) want to know: with the market inflated right now at PE = 25, what SWR should we be using to decide if we have enough savings to stop working? And how worried should we be if the market tanks?
Well, since the data is all out there, let’s see how it stacks up. I’ve already shown you the historical data above; now the easy part is to plot the two data sets against each other. That’s what I did in Figure 3.
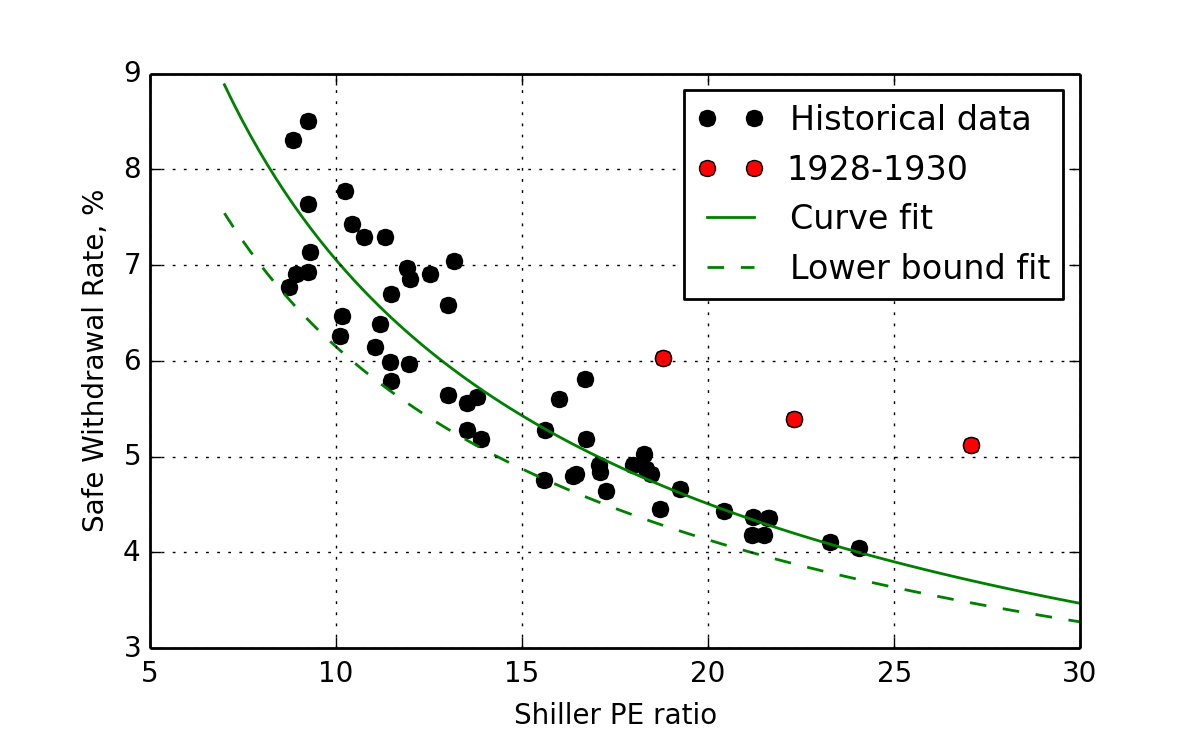
It is amazing just how nicely all the data lines up; the trend is really very clear. But first, a couple notes on the chart:
- The red dots are the years 1928, 1929, and 1930—which anyone will agree were among the most pathological years of the market. I left out those three points when doing curve fits, to make things prettier. Anyway, since those three dots give a very rosy picture (> 5% SWR at elevated PE), leaving them out only serves to make the conclusions more conservative.
- The solid green line is a power-law curve fit to the data—the “average”, if you will.
- The dashed green line is my eyeball fit to the lower bounds of the data—the “worst case scenario”.
The takeaway here is really quite clear: the higher the PE ratio is, the lower your assumed SWR should be in your retirement planning. At present-day PE of about 25, the SWR is about 4%, which corresponds to the worst-case SWR in Bergen’s work. On the other hand, if you retire in several years, and the PE ratio has by that time fallen to, say, 15, (either because prices have fallen or earnings have risen) then your SWR is really more like 5%. And if you retire at the bottom of a market crash, when the PE is 10…you should be able to enjoy a SWR of 6%–7%, because the recoveries after crashes tend to be pretty robust.
Psychologically, this is hugely counterintuitive! A booming market makes people feel rich and spendy; a market crash makes them feel vulnerable and frugal. But history is clear: the best time to retire is at the bottom of a crash, if you still have the money to do it.
Now of course, at market bottom when PE is low, your portfolio has presumably also been battered and your higher SWR on a smaller stash will still equate to a smaller absolute dollar amount. But it’s not quite as bad as you might think. Why? Because the rise in SWR cushions the fall in portfolio value. That effectively means this: if your portfolio value falls 20% in a market correction just before your retire, the dollar value of your withdrawal will not fall by 20%; it will only fall by 7%–8%. Figure 4 lays this out explicitly.
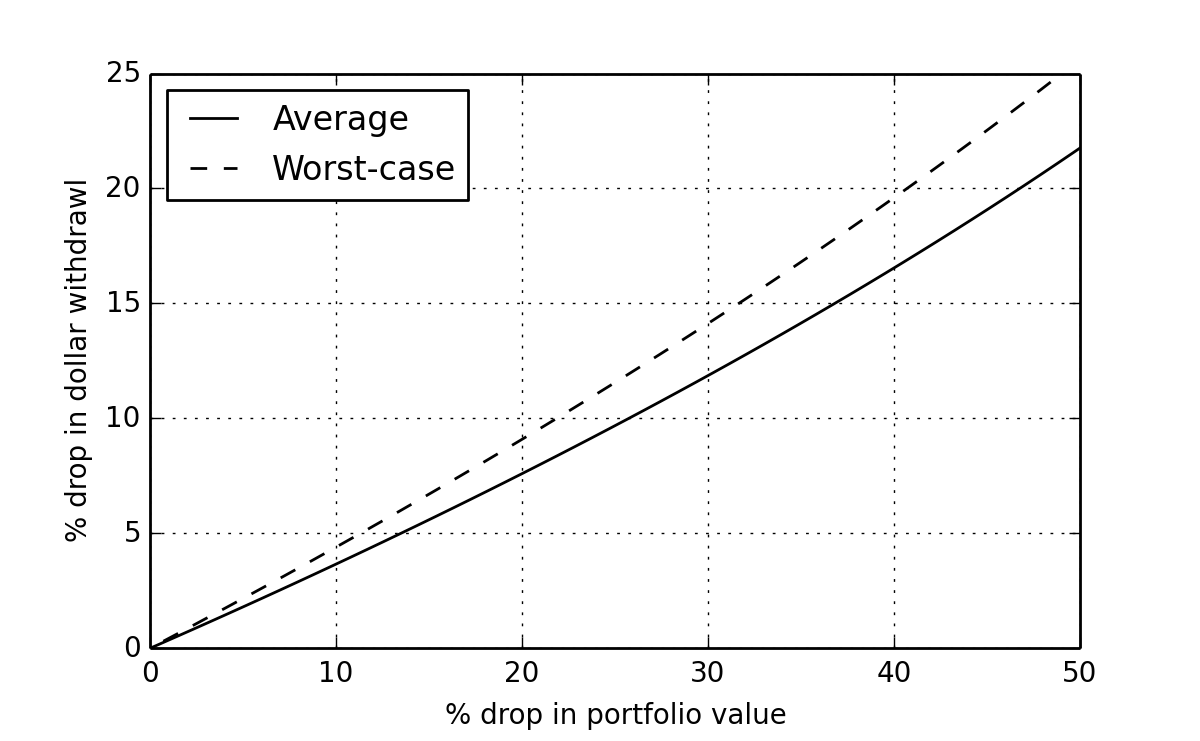
As a rule of thumb: if your portfolio drops by x%, you will always be safe by dropping your planned spending by x/2 %. To make this concrete, here’s a scenario that may well be completely realistic:
- You have, again, a cool $1M invested in the stock market today, where the PE ratio is 25. You plan on using a 4% SWR, in accordance with Figure 3, when you retire in December of this year. That will give you $40,000 per year to live on. You figure you need $35,000, so you have a small cushion.
- In November, the stock market ‘corrects’, losing 40% of its value. Your $1M has become $600,000. Your 4% SWR now says you have only $24,000 per year to live on if you retire in December…which is not enough.
- But now, since the stock market tends to recover robustly after a crash, you re-figure your SWR based on the new PE ratio (which is now 40% off its high of 25, and so is 15) and find that it’s now 5.5% (using the average) or 5% (using the worst case). So your actual dollar withdrawal available is now somewhere between $30,000 and $33,000…not quite the $35,000 you needed, but way closer than $24,000. Now, you just have to exercise some flexibility to make your spending match your new SWR, and your retirement, though dented a little, is saved.
In this scenario, you lost $400,000 in market value, but your available spending only fell about $7,000 per year (not $16,000, as a rigid 4% SWR would dictate). The market’s history tells us that disasters just aren’t quite as bad as they seem.
Epilogue
Received wisdom is both a fantastic shortcut to understanding the world and a dark woolen blanket covering your eyes—that is, it can work for you, or work against you. In this case, the 4% SWR rule of thumb gives you a quick answer to whether you are in the ballpark of being able to retire on your savings. But applied rigidly, it can also be misleading, and many of the personal finance bloggers out there have opined that, due to their own conservatism using the 4% rule, they worked too long and have more money than they really need. On the other hand, by understanding where the SWR comes from in the first place, and what factors influence it, we can make the concept work for us to make the world’s uncertainty seem a little less daunting. And that, in turn, frees up some of our mental cycles from worrying, and lets us pursue other things—things leading further toward our Jailbreak.

4 Comments